
X-ray Fluorescence and Neutron Activation Analysis of Obsidian from the Red Sea Coast of Eritrea — illustration 1, PDF page 4
Source record
- Source
- Habesha History book corpus — X-ray Fluorescence and Neutron Activation Analysis of Obsidian from the Red Sea Coast of Eritrea
- Book
- X-ray Fluorescence and Neutron Activation Analysis of Obsidian from the Red Sea Coast of Eritrea
- Source reference
- X-ray Fluorescence and Neutron Activation Analysis of Obsidian from the Red Sea Coast of Eritrea; PDF page 4; embedded illustration 1, exact source rectangle 72.0, 72.0, 297.12, 253.32
- Page
- 4
- Publication year
- 2008
- Type
- Book illustration
Date of image not recorded.
Creator not recorded.
Source-book and PDF-page attribution only. No place, subject, creator or image date is inferred from nearby body text or the publication date.
Source-page captions
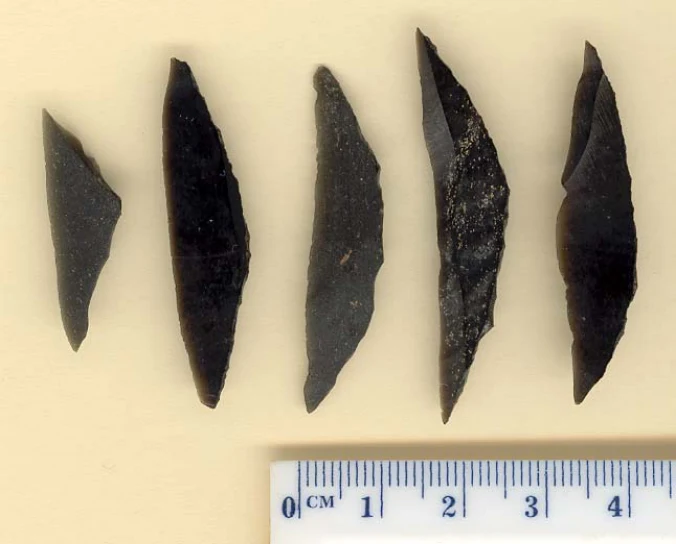
Fig. 2. Selected artifacts from Misse East: Backed blades and geometric tools The XRF analyses were conducted at 35 kV using a tube current of 45 microamps and an operating time of 400 seconds. Concentrations were calculated in parts per million by the ElvaX Regression program based on use of a quadratic regression model for a series of obsidian reference samples previously characterized by both XRF and NAA. The XRF analysis permits quantification of the following elements in obsidian: K, Ti, Mn, Fe, Zn, Ga, Rb, Sr, Y, Zr, and Nb. After completing the analysis by XRF, a subset of the artifacts and the three Kusrale Basin samples were analyzed by NAA to obtain higher resolution data. Due to the destructive nature of sample preparation by NAA, only twenty artifacts were available for analysis. The procedures employed were described in Glascock et al (1999).
Fig. 3. Bivariate plot of Fe and Rb showing the XRF data obtained for three Kusrale Basin source samples and 93 obsidian artifacts from three sites along the Red Sea Coast of Eritrea. Note that Fe can be converted from ppm to percent by dividing by 10,000
Illustration from the identified source publication. Captions on the source page are preserved separately and are not asserted to belong to this individual crop. Publication year is not the image date.
Image rights
Original publication and credited image creators retain their rights. No open licence has been established for this corpus copy.
User-confirmed permission to use images in the local Habesha History corpus, 2026-09-28; this does not grant visitors a general reuse licence.
Request image removal